Network Anomaly Detection: UK Measles (GitHub)
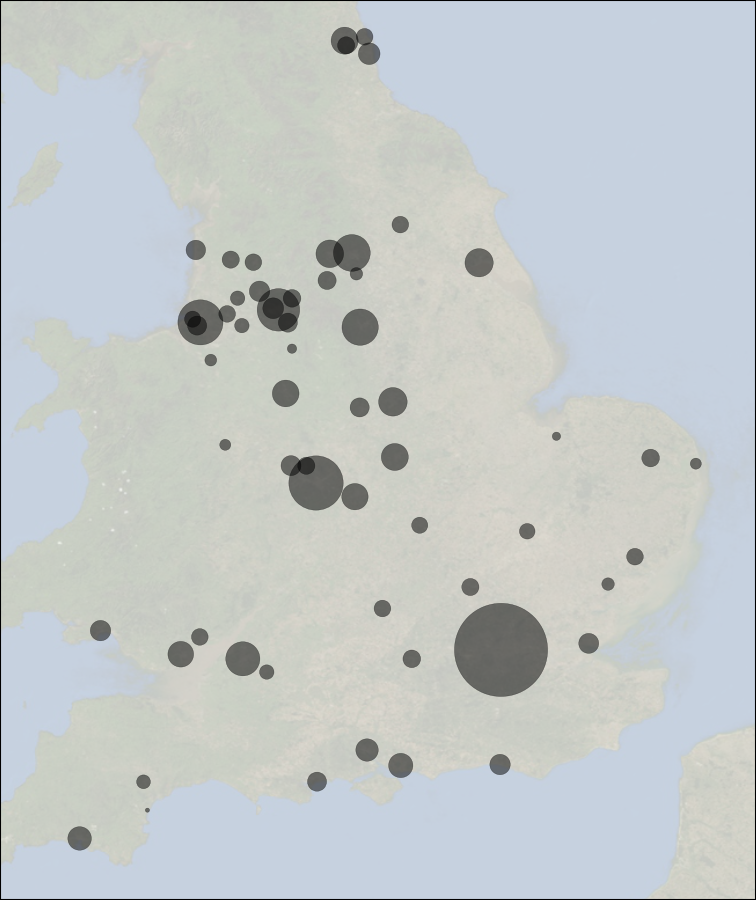
Ottar Bjornstad has made publicly available data on measles outbreaks in the 60 largest cities of the UK from 1944 to 1966.
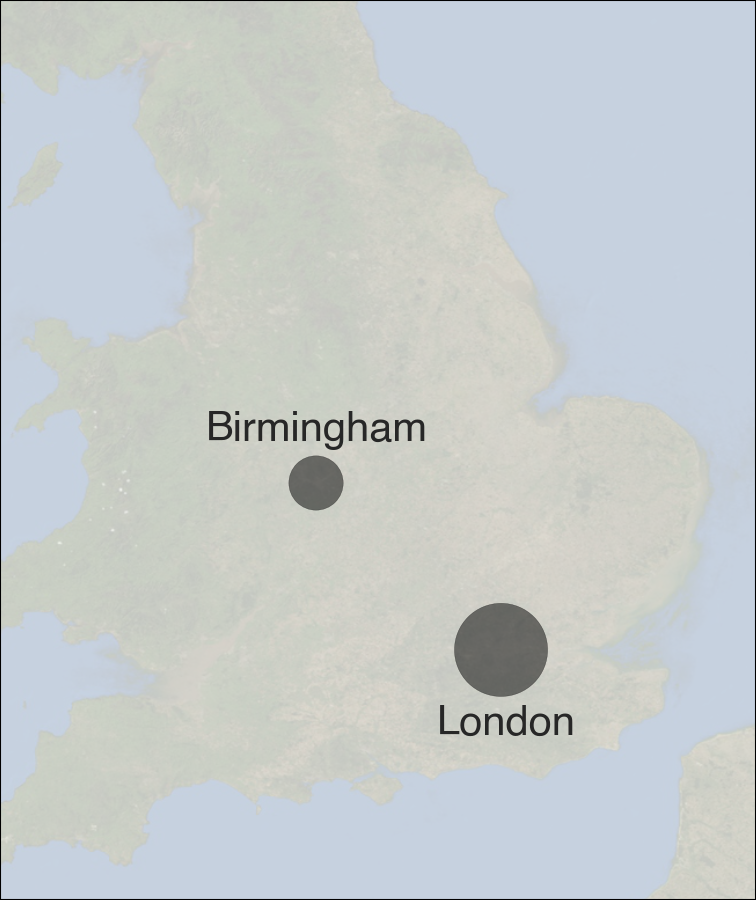
London and Birmingham were the two cities with the largest population during this period.
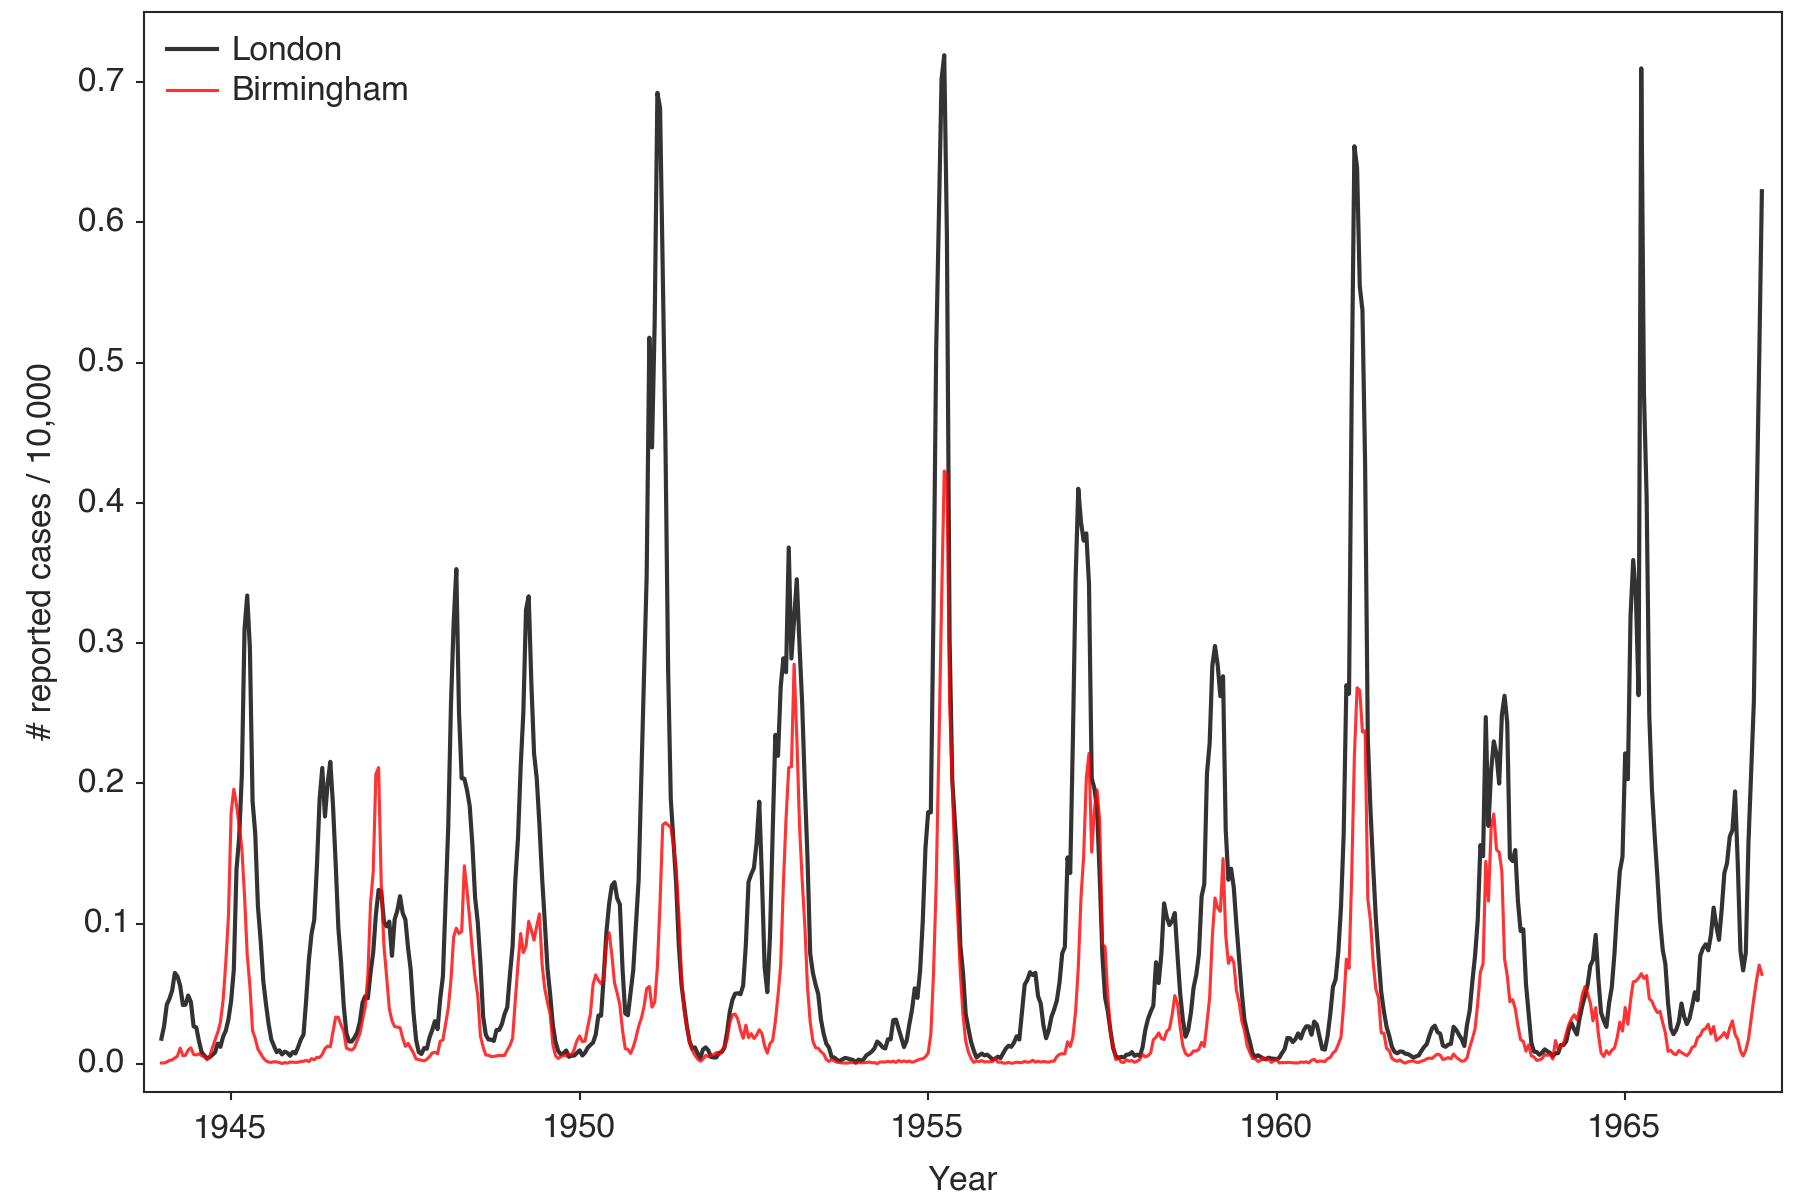
High birth rates in the cities fuel epidemics with large numbers of susceptible individuals. Outbreaks are ignited in large urban areas and then propagate through surrounding areas.
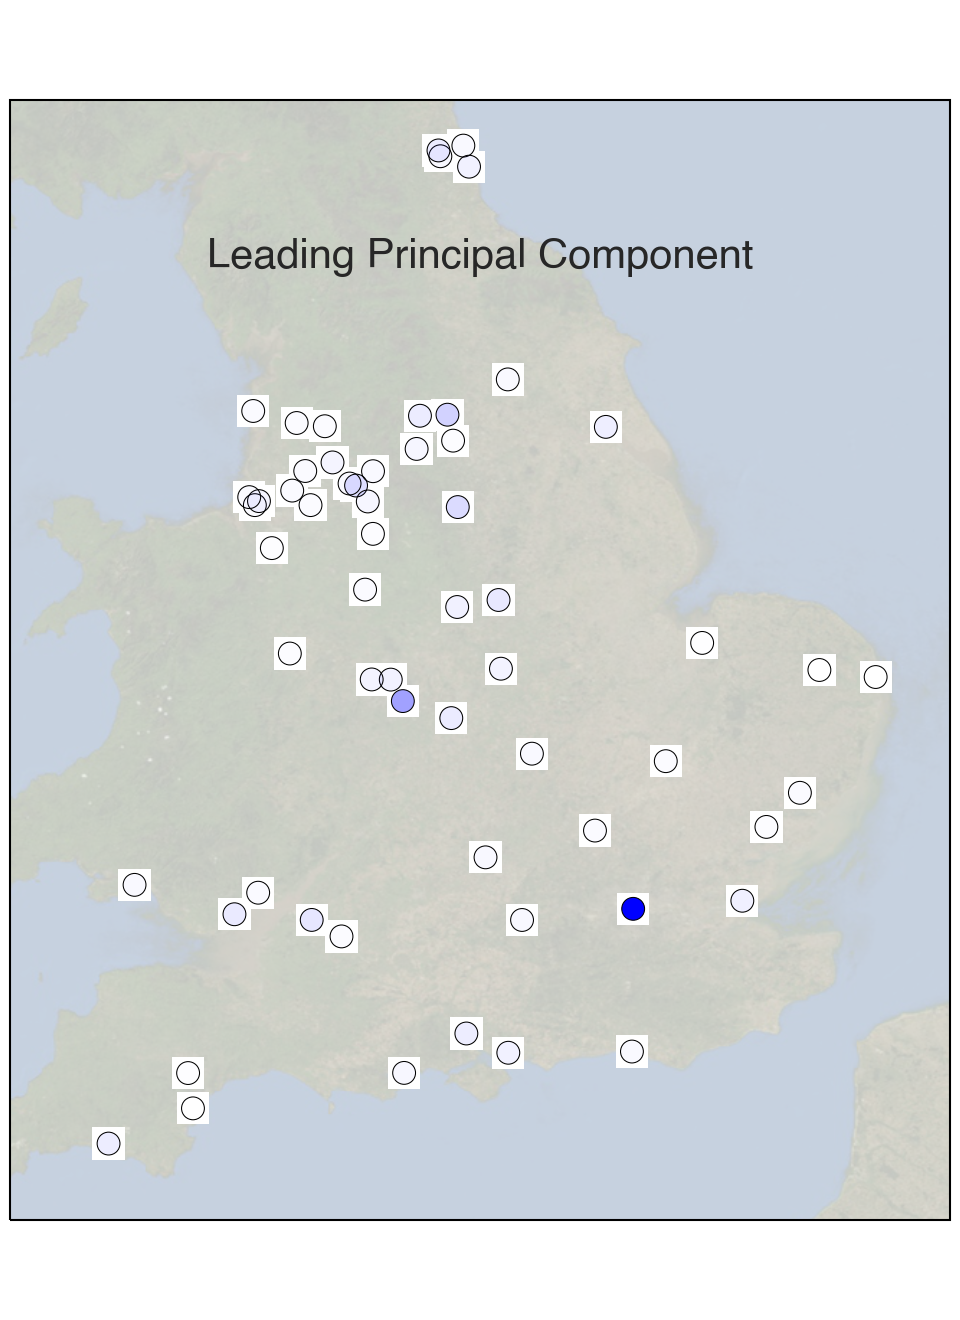
A Principal Component Analysis on the complete spatiotemporal data set shows that 74% of the variation in the data can be explained by the leading principal component. This component describes a spatial outbreak pattern that is remarkably stable through time.
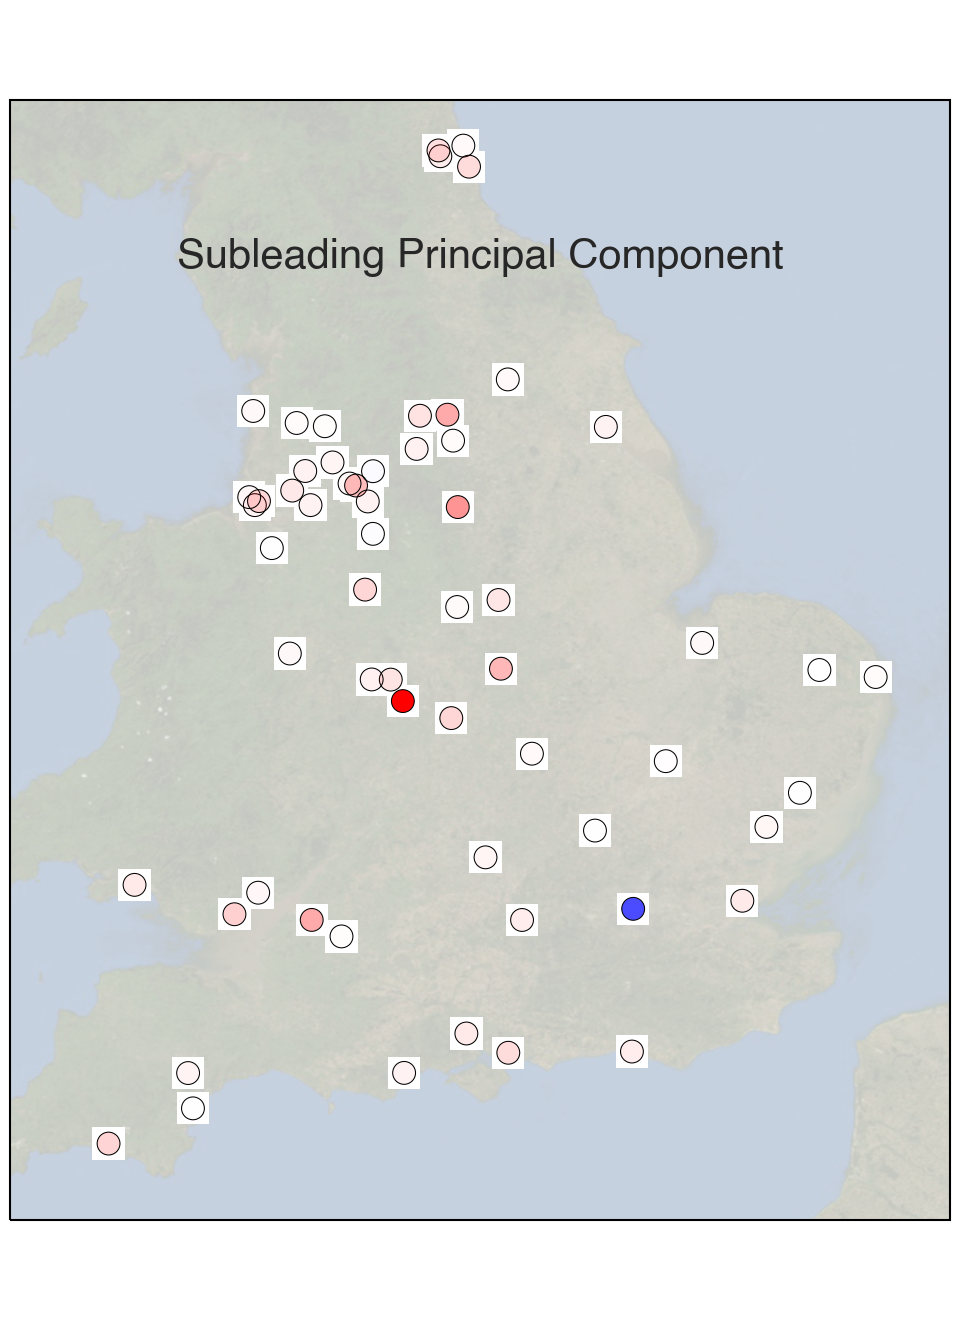
The subleading principal component, describing 7.2% of the variation in the data, is a sloshing mode. Blue and red disks indicate fluctuations that are opposite in sign. Clearly, fluctuations in London case reports tend to be out-of-sync with all other cities and strongly out-of-sync with Birmingham.
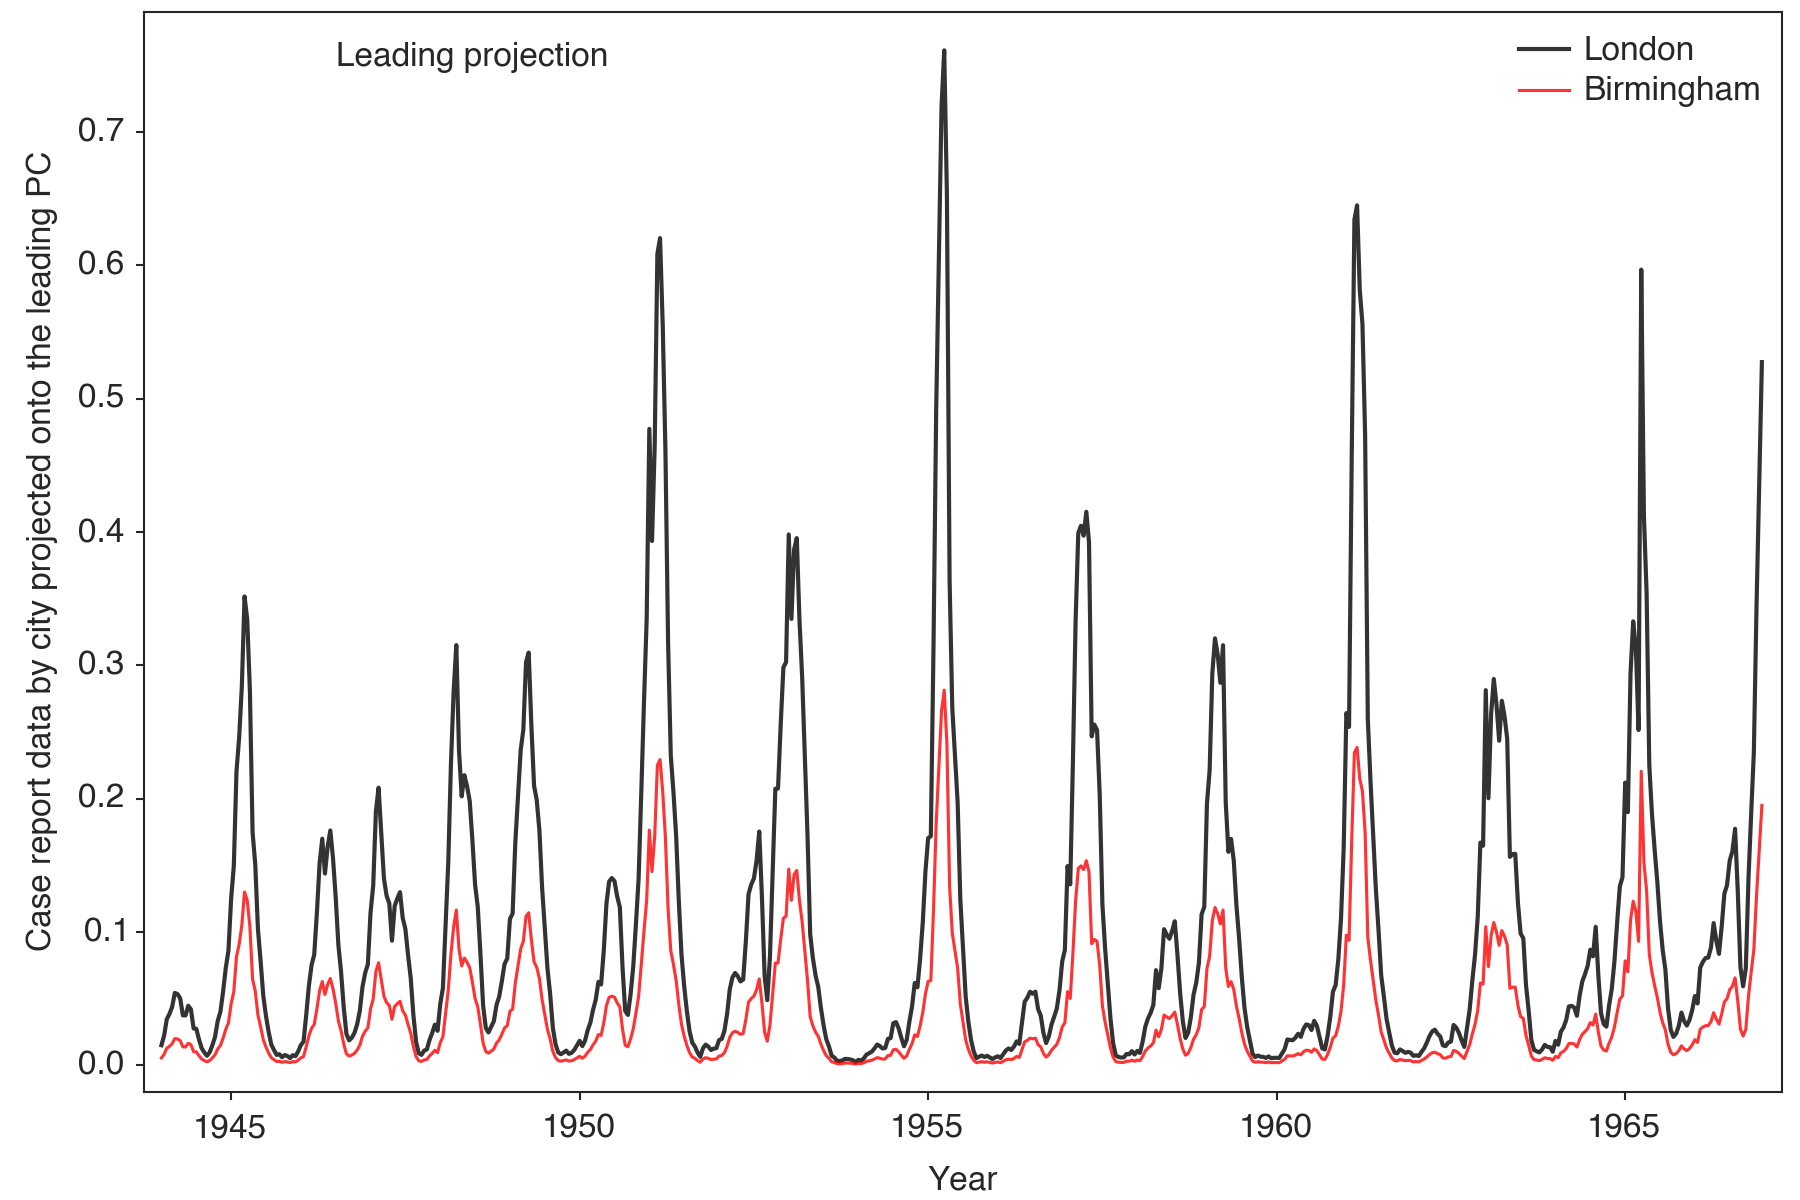
Projecting measles case reports for the two largest cities onto the leading principal component, which describes the dominant pattern of spatial variation, yields an exellent approximation to the original data (compare this figure with the time series plotted above). In this sense, PCA is a tool for de-noising dynamcial network data, i.e. resolving the dominant mode of variation that predictive models must capture.
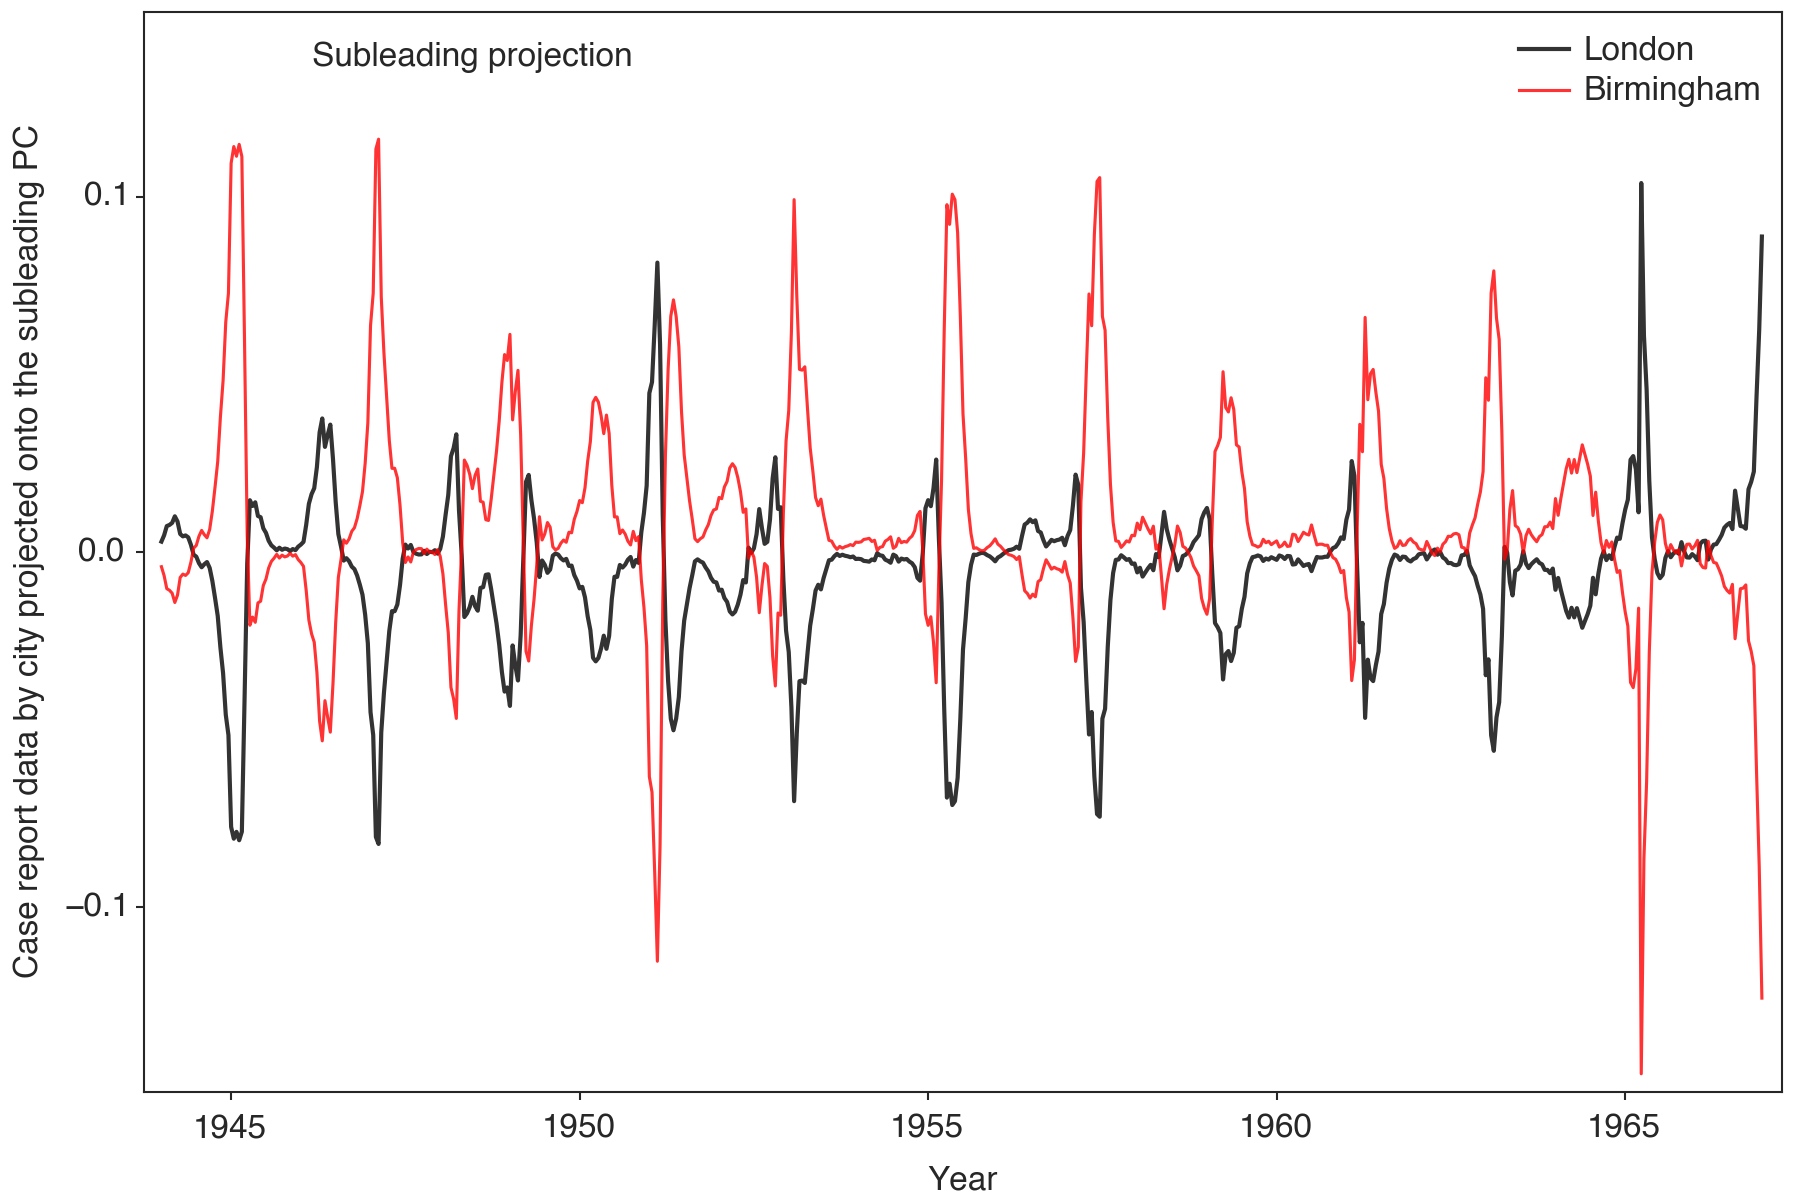 Projecting
onto the subleading principal component immediately allows us to detect a sudden
transition after 1965. Outbreaks in London
appear to become stronger, while outbreaks in Birmingham
appear to weaken. However, in this case, the anomaly lies
not in the disease dynamics but rather in
data recording practices. In 1965, the Greater London Council annexed the
metroland suburbs, which redefined the boundaries
of the city. Case reports for the newly enlarged city were
reported in 1965 and 1966, faking an outbreak anomaly. This
illustrates the utility of a PCA in data quality assurance
and cleaning.